- Why Isochrone Maps Are Enjoying a Renaissance: As data sources keep improving, mapmakers keep finding more uses for the 19th-century invention. (Atlas Obscura)
- Shaping Conversations about Transit with Interactive Isochrone Mapping (Conveyal)
- Evaluating Accessibility for Transport Planning: Measuring People's Ability to Reach Desired Goods and Activities (Victoria Transport Policy Institute)


Overview
How would a fast, reliable and seamlessly integrated public transit system improve life in the San Francisco Bay Area? To answer this question, Interline has worked with Seamless Bay Area to model its Vision Map to understand how implementation of this vision would make it faster and easier to get around the Bay Area on transit. Read more on how the Seamless Bay Area Vision Map was created. This work has been generously funded by a grant from Microsoft.
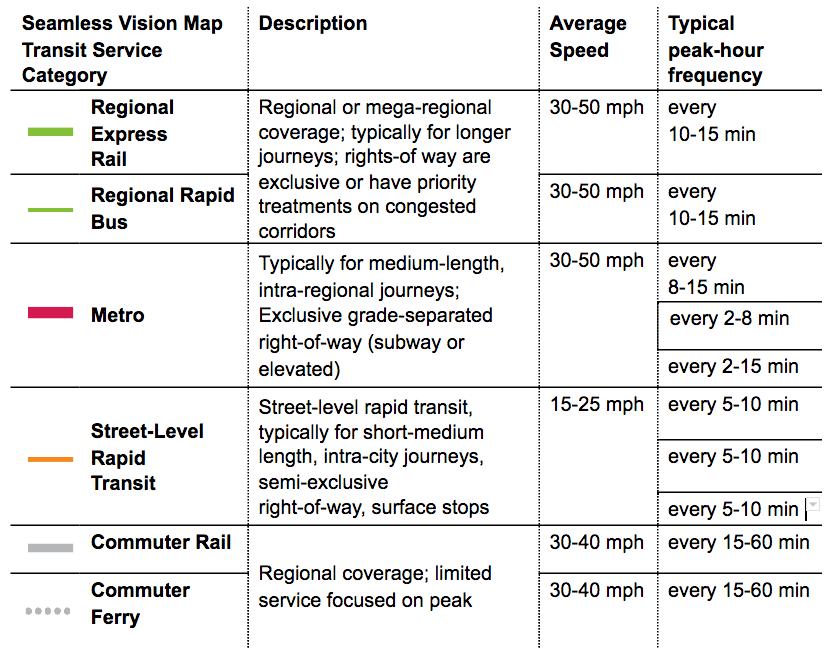
Vision Map Service Levels
Because there are no service standards for transit in the Bay Area, Seamless Bay Area and Interline worked together to standardize the definition all of the various types of transit in the region into a few simple categories. Only rapid and regional lines are shown on the Vision Map; local and/or less frequent transit lines would still exist but are not displayed.

Accessibility Analysis
The goal of this analysis is to determine where people can reasonably travel by transit. Accessibility analysis can be performed from an origin point; for example, from your house. Or it can be performed to a destination point; for example, to your office. When performing accessibility analysis from an origin, we calculate all of the area that can be reached from your house within 60 minutes (or some other defined amount of times).
The result of an accessibility analysis is called an isochrone. That's the combination of "iso" for same (in Greek) and "chrone" for time. It's the area reachable in the same amount of time. An isochrone can also be called a travelshed. Like a watershed, an isochrone/travelshed can have jagged edges. Unlike a watershed, isochrones are not necessarily contiguous. Train stations and ferry terminals can mean that riders can access destinations around the stops, but not necessarily all along the route line. Therefore, transit isochrones can look like islands.
Often isochrones are combined with other geographic data. In the accessibility analysis of the Seamless Vision Map, we've used residential and workplace demographics. After caluclating an isochrone to or from a given destination, our analysis software counts the number of residences or the number of workplaces within each isochrone.
Explore the Accessibility AnalysisRelated Resources
For more information on transit planning and accessibility analysis: